
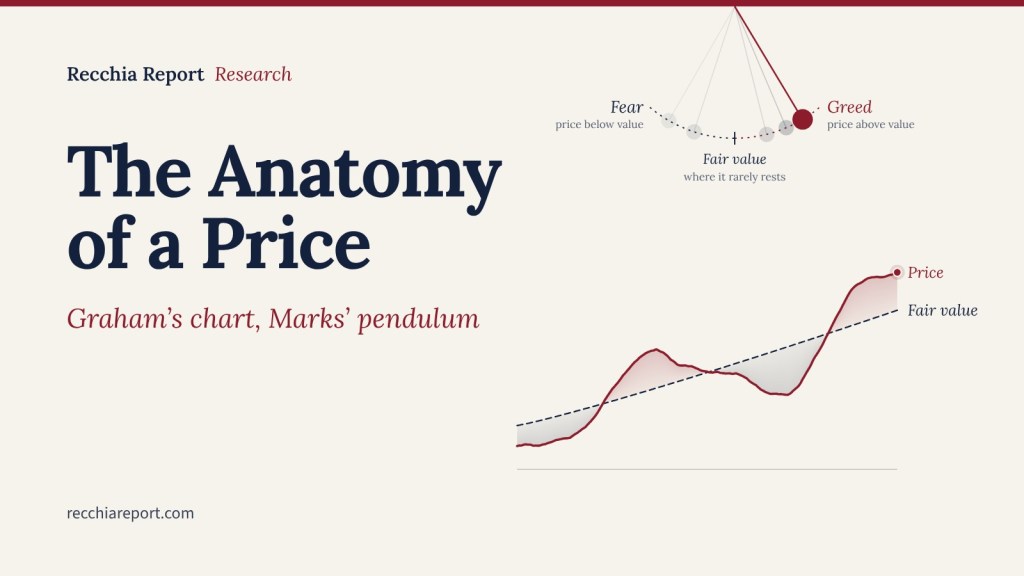
The best picture of how a share price is made was drawn in 1934 and fits on half a page. It sits in the first chapter of Graham and Dodd’s Security Analysis, in a chart titled “Relationship of Intrinsic Value Factors to Market Price”, and most readers skim past it on the way to the chapters about balance sheets.
That is a mistake. The chart is a causal diagram, not a list. It says where price comes from, which inputs an analyst can actually work on, and why the number on the screen so rarely equals the value of the business behind it. More than ninety years later nothing in it has gone stale.
This piece does two things. It walks through Graham’s chart as he drew it. Then it redraws the same chart with Howard Marks’ ideas in the boxes, because Marks’ memos are, almost line for line, a commentary on the right-hand side of Graham’s diagram.
What Graham Drew
The chart reads left to right. On the left are the inputs. On the right is a funnel that every input has to pass through before it becomes a price.
Graham splits the inputs into general market factors and individual factors, then splits the individual factors into speculative and investment. The speculative side holds what he calls market factors: technical (the supply and demand of the stock itself), manipulative (pools, promoters, deliberate price pushing) and psychological (crowd sentiment). The investment side holds the intrinsic value factors: earnings, dividends, assets, capital structure, the terms of the issue.
Between them sits a row he labels future-value factors: management and reputation, competitive conditions and prospects, and probable changes in volume, price and costs. The bracket deliberately puts this row under both headings. Forecasting the future is part analysis and part guesswork, and Graham draws it that way rather than pretending otherwise.
Then comes the part most people miss. None of these inputs sets the price directly. All of them feed a single box, the attitude of the public toward the issue. That attitude produces bids and offers, and bids and offers produce the market price. Price is three steps removed from the facts.
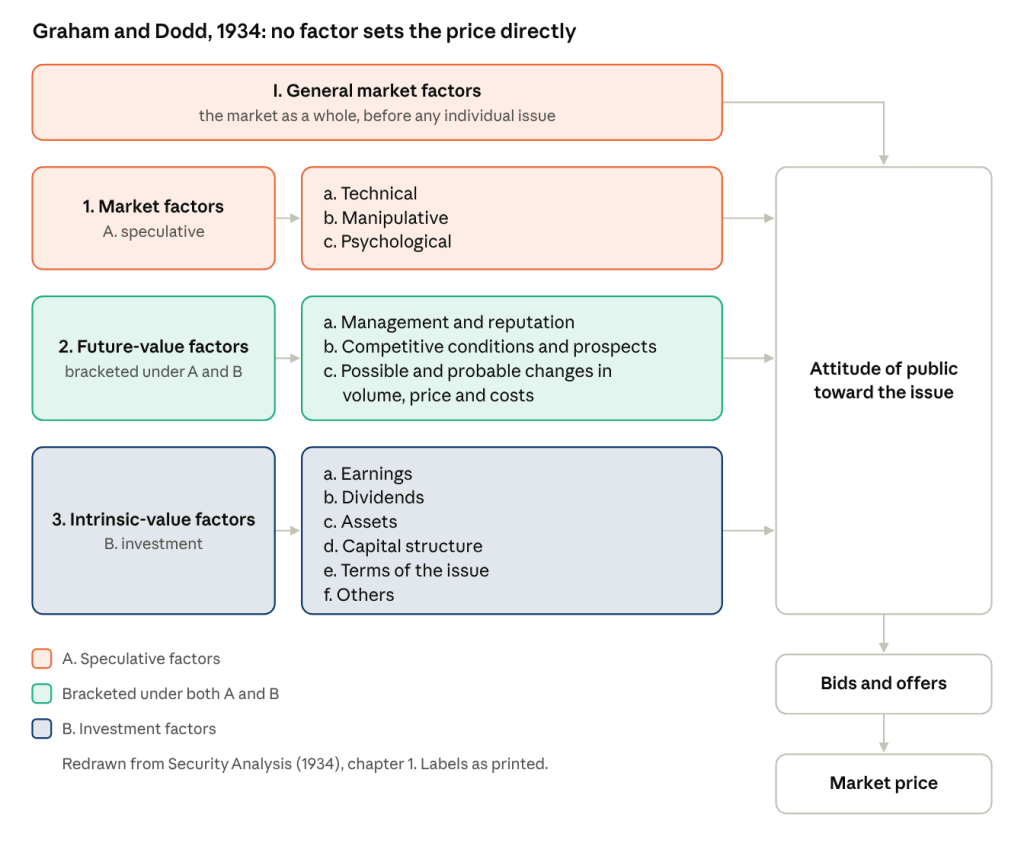
Graham drew this with brackets rather than boxes, but the structure is the same. Read it as a funnel: the wide end on the left takes in everything that can move a stock, the narrow end on the right lets out a single number.
What the Funnel Says
Price is the public’s opinion of the facts, and the facts are only one input to that opinion. That is the whole chart in a sentence, and Graham and Dodd say it themselves in the text right beside it: the market is not a weighing machine that records each issue’s value impersonally, but a voting machine, where countless individuals register choices that are partly reason and partly emotion. The famous short-run, long-run version of that line is a later paraphrase of this passage.
Three things follow from it.
First, the analyst can only really work on the bottom rows. Earnings, assets and capital structure can be measured. Competitive position can be assessed with a margin for error. The speculative rows cannot be analysed at all, only observed. Graham draws them in full anyway, which is rarer than it sounds. Most frameworks quietly leave out what they cannot handle.
Second, the gap between price and intrinsic value comes from the top of the chart, not the bottom. When the speculative and psychological rows dominate the funnel, the output detaches from the facts. That gap is the margin of safety. It is also why a cheap stock can stay cheap for a long time: the facts have not changed, the attitude has not either.
Third, intrinsic value is a range, not a number. Graham is explicit that you need it only to decide whether a price is clearly too high or clearly too low. The chart does not need precision at the bottom to be useful, because the noise at the top swamps any precision you could produce.
Why It Has Not Aged
The chart was published five years after the 1929 crash, by a man whose fund, the Benjamin Graham Joint Account, had lost about 70% between 1929 and 1932. That shows. It is a diagram written by someone who had just watched the bottom rows of the chart count for nothing against the top rows for three straight years, and who wanted to explain to himself how that was possible.
The labels date, but the structure does not. Relabel the speculative row for 2026 and it still works. Technical becomes positioning and momentum. Manipulative becomes flows: index inclusion, passive rebalancing, options dealers hedging gamma, a forced seller in a fund that is being redeemed. Psychological becomes narrative, which is the same thing with a better marketing department. None of these move the earnings of the business by a cent, and all of them move the price.
What has changed is the weight of the top row. In 1934 the manipulative category meant a pool of wealthy operators running a stock up. Today it means mechanical buying and selling that has no view on value at all, and it is a larger share of daily volume than Graham could have imagined. If anything the funnel is narrower than when he drew it, because more of the inputs arrive with no opinion of the facts attached.
The chart also survives because it is honest about its own limits. Graham draws the rows he cannot analyse in full, with the same weight as the rows he can. A framework that admits what it cannot do tends to outlast one that pretends to cover everything.
The Same Chart, Redrawn for Marks
Howard Marks has never, as far as I know, cited this diagram. He does not need to. Put his vocabulary in Graham’s boxes and the chart barely changes shape.
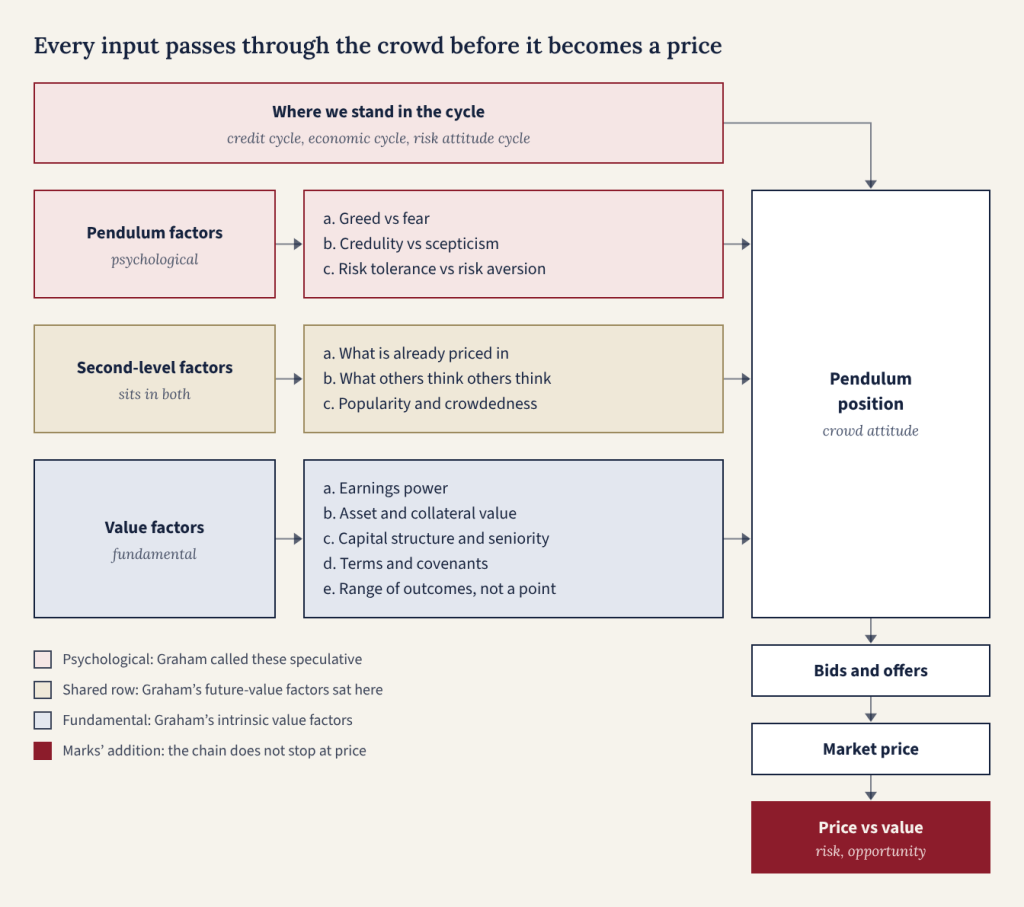
The skeleton is Graham’s. The inputs sit on the left, the funnel on the right, and every arrow still runs through crowd attitude before it reaches price. Three things have moved.
The cycle sits on top and feeds the funnel directly. Graham lists general market factors and moves on. For Marks they are the dominant input. Mastering the Market Cycle is essentially Graham’s top row expanded into a book: the credit cycle, the economic cycle and the cycle in attitudes to risk, all pushing the crowd one way at once. His point is that you cannot predict where the cycle goes next but you can know where you stand in it. That is the same humility Graham applied to his speculative rows: you cannot analyse them, but you can observe them.
Marks’ most useful empirical claim sits inside that top box. The pendulum, he writes, swings between greed and fear, between credulity and scepticism, between risk tolerance and risk aversion, and it spends almost no time at the midpoint. In Graham’s terms, the attitude of the public is almost never neutral, so price is almost never equal to value. Graham drew the funnel as a still picture. Marks adds a clock to it, and the clock is what turns a description into something you can act on.
Second-level thinking replaces future-value factors as the shared row. Graham’s overlap was about forecasting. Marks’ overlap is about consensus. What the crowd already believes is both a psychological fact and an input to your valuation, because a good company priced for perfection is a bad investment. First-level thinking stops at the value row. Second-level thinking asks what is already in the price, and that question belongs to both halves of the chart.
The chain does not stop at market price. Graham’s output is the price. Marks adds one more box. Price measured against value is where the two things he actually cares about live: risk, which he defines as the probability of permanent loss rather than volatility, and opportunity, which is the contrarian entry. Risk is highest when price has drifted furthest above value because the crowd is most comfortable. Opportunity is the mirror image. That last box is the whole reason to draw the chart.
The value row is also quietly rewritten. Graham’s list is equity shaped: earnings, dividends, assets. Marks’ list is credit shaped: collateral, seniority, covenants, the range of outcomes. Oaktree’s roots are in high yield bonds and distressed debt, where the terms of the issue can matter as much as the business behind it, and the chart should say so.
Reading the Two Charts Together
Graham gives you the anatomy of a price. Marks gives you its physiology: how it moves, and when the movement is exploitable. Read as one framework, the memos stop being aphorisms and start being a method.
The method has three parts, and the chart tells you which part you are in.
- Analyse the bottom row. Earnings power, balance sheet, capital structure, the terms you are actually buying. This is the only part of the chart where effort reliably produces an edge, and it is where Graham spent his career.
- Apply a margin of safety to the middle row. Forecasts and consensus are partly knowable and partly not. Marks’ version of this is to ask what is priced in before asking what is true. If everyone already agrees, the agreement is in the price and your analysis adds nothing.
- Observe the top row, and do not pretend to analyse it. You cannot model the pendulum. You can tell whether it is near an extreme by watching behaviour: the terms lenders accept, the deals that get done, the arguments people stop making. When attitude dominates the funnel, price detaches from value in both directions, and that is when the last box on the chart matters most.
Where the two men part ways is what to do about the top row. Graham treats speculation as something to keep strictly separate from investing. Marks treats the swing itself as the opportunity set and builds his whole approach around being the buyer when the attitude is worst. Graham wants the margin of safety measured against hard numbers. Marks is comfortable with value as a judgement, as long as the price is far enough below it.
For a reader of this site the practical use is as a checklist. The value row is the hard gate. The shared row is where you need a discount. The top row is why a cheap position can stay cheap for a year, and why that is not evidence the analysis was wrong.
The Question the Chart Leaves You With
Every position you hold sits somewhere on this diagram. The honest question is not whether the business is good. It is which row is currently setting the price, and whether you are being paid for the rows you cannot analyse.
If the answer is the bottom row, you are investing. If it is the top row and you know it, you are speculating with your eyes open, which Graham accepted as long as you knew it was speculation. If it is the top row and you think it is the bottom row, the chart was drawn for you.
Further Reading
- Benjamin Graham and David Dodd, Security Analysis (1934), Part I, “Survey and Approach”, chapter 1, “The Scope and Limitations of Security Analysis. The Concept of Intrinsic Value”. The chart is titled “Relationship of Intrinsic Value Factors to Market Price”.
- Howard Marks, The Most Important Thing (2011), the chapters on second-level thinking and understanding risk.
- Howard Marks, Mastering the Market Cycle (2018).
- Oaktree memos closest to the chart: “The Happy Medium” (2004), “It Is What It Is” (2006), “On the Couch” (2016).
Know the market. Understand the world.


Leave a Reply